Please, if you are not really interested in CANBUS and OBD tools, do yourself a favour and skip this post. If you decide to continue, do me a favour and don't ask me "why would you". As the only answer I can give you is "not because I have to, but because I can" :mrgreen:
Until a little while ago, I have been capturing OBDII data by sending requests and capturing responses to the requests. There are two disadvantages to this approach:
- It is relatively slow, as a single request may take up to 250 msecs to be fulfilled and for a decent dashboard you may easily need 10 different requests. The result is a sweep time of 2 - 3 seconds. Not very attractive.
- You are transmitting requests ONTO the CANBUS. Compared to the fast amount of data found on the CANBUS at any moment, it is very, very little and should be of no consequence. But yet, there is a tiny risk of interfering.
So, I have been investigating an alternative approach (for example also used by the CANION app for the iMiEV): listening in on the ongoing communication between different ECUs and sensors in the car. The idea is to write a program that monitors all traffic and buffers the last version of each type of data item, so requests from Torque Pro (or any other OBD tool) can be quickly fulfilled by this program using the buffered data. My first tests with very elaborate dashboards show sweep times of (if I have to guess) a quarter of a second. Very promising.
During one of the first road tests I did, I captured about 6.5M data items (filling a 622 MB CSV file) during a 90 minute trip. The amount of data was rather intimidating, but nevertheless I took a crack at it. I was able to recognise quite some interesting parameters. But the parameters I was able to identify seemed mostly related to the 'conventional' part of the car. I could not find anything that seemed related to for example the rear E-motor or the generator. Then I remembered the CANBUS diagrams that have been posted here earlier. Closer study of these diagrams revealed that the main CANBUS is effectively split into two with the PHEV ECU acting as a firewall between the two halves. This is done to limit the amount of traffic on each of the halves. Only data that is needed on both sides is allowed to pass the PHEV ECU from one half to the other. As a consequence, from the OBD diagnostic port you can only listen in on the traffic on one half of the main CANBUS. The half that harbours the more conventional ECUs.
So, this weekend, I used the Russian workshop manuals to locate and identify the wires for the other CANBUS half. I managed to tap into them at the connector that connects the rear E-motor ECU to the CANBUS. To this tap, I connected a female OBD connector, effectively creating a second OBD diagnosis port. Today and yesterday, I have been able to monitor traffic on the second half of the CANBUS with some interesting successes.
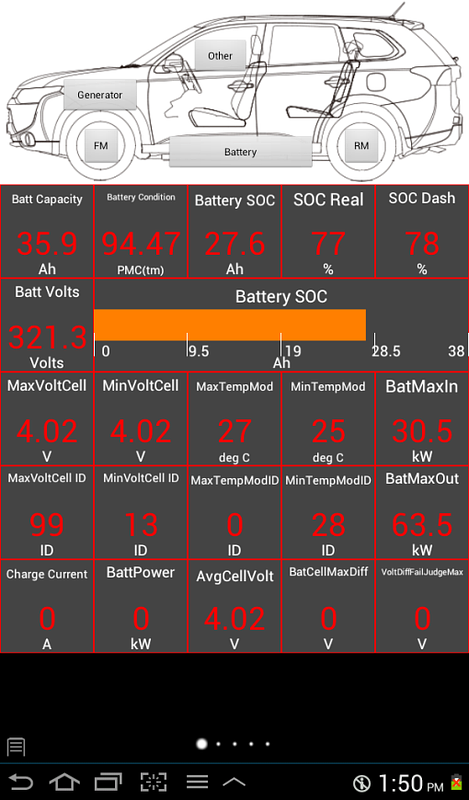
One of these successes is that I am now able to monitor SOC at 1/100th (!) of a percent. I can just watch it go up and down while driving .... I can witness SOC go down during coasting, because power is used for eliminating e-drag and such. Very nice.
Below graphs give another idea of the kind of information I was able to retrieve by monitoring the existing communication on the second half CANBUS. I have selected some graphs that focus on the generator. These graphs reflect the last few kms or 7.5 minutes of my 40 km daily commute into the office this morning. I almost made it pure EV this morning, but I fell a few 100 meters short. So, the engine started up when I could already see the office building. Th engine ran for about 65 seconds, 50 of which were the warm up phase, where the engine was not really contributing, and 15 were actually useful. After the 15 seconds I arrived at the last traffic lights and the remainder of the trip was pure EV in the parking lot at very low speed.
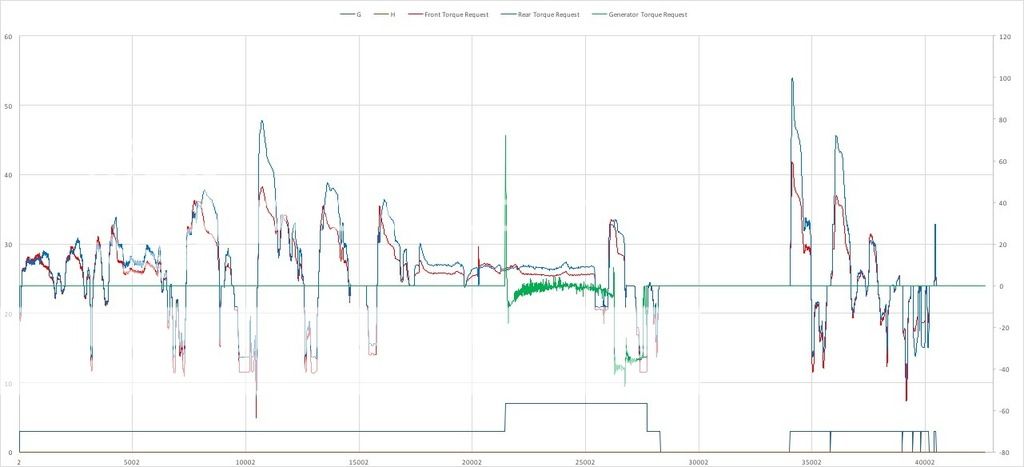
Requested Torque for Front and Rear Motor and Generator (approx. 42.000 frames during 7.5 minutes)
This graph shows the PHEV ECU asking the front (red trace) and rear (blue trace) e-motors to propel or slow down the car by requesting positive or negative torque. In the middle section, you see the PHEV ECU asking the generator to start the engine (positive spike in the green trace). Then you see that, during a warm-up phase of 50 seconds, the engine is nearly idling, as the generator is asked to produce only very little resistance (negative torque). In the last 15 seconds, the generator is asked to produce some more resistance / generate a bit more electric power.
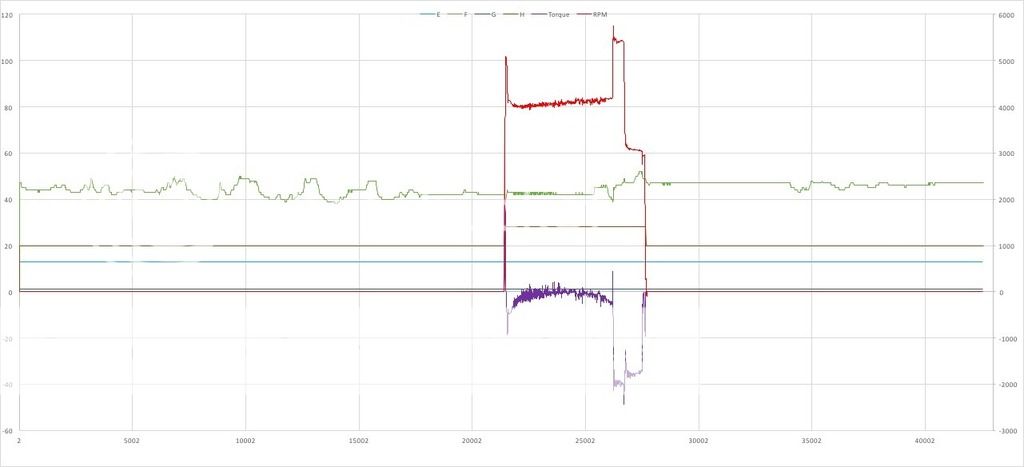
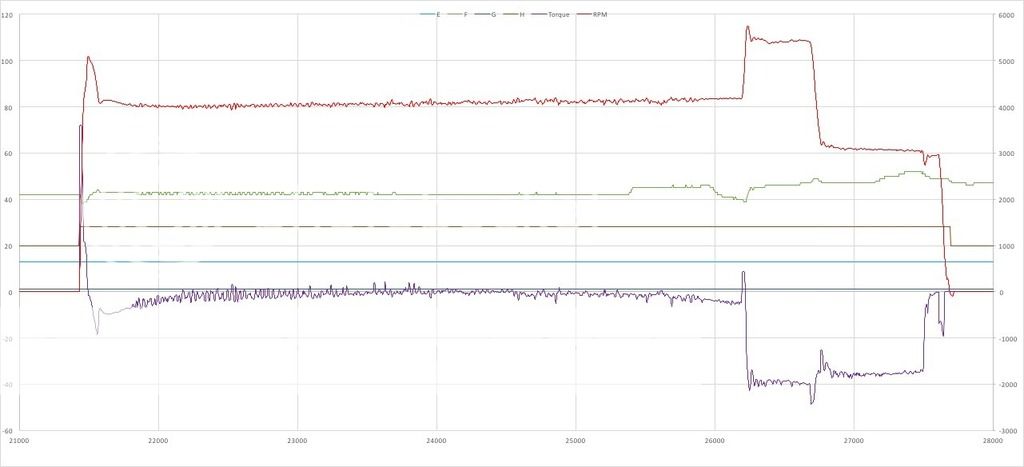
Generator Actual Torque and RPM (approx. 42.000 data frames captured during 7.5 minutes)
The purple trace is Actual Torque produced by the generator, positive when starting the engine or negative when generating electric power. Actual Torque follows Requested Torque very closely. The red trace is generator RPM, roughly three times engine RPM, I guess. The brown trace appears to be a 'running state' or such. What the green trace is, I have no idea about yet. I am especially curious about that one, as it is showing activity even before the generator is woken up by the PHEV ECU.
Generator Torque and RPM (zoomed in)
Same as above but zoomed in into the more interesting part of the 7.5 minutes.
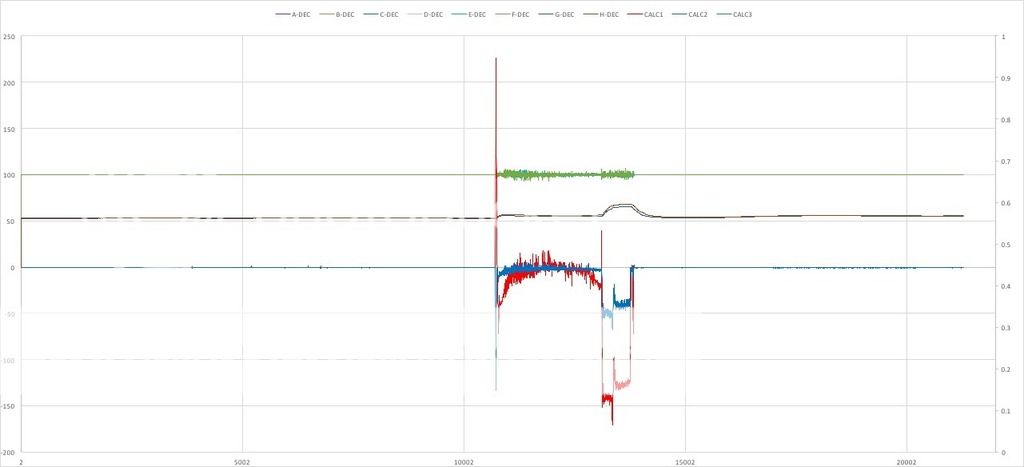
Generator Currents (approx. 21.000 data frames captured during 7.5 minutes)
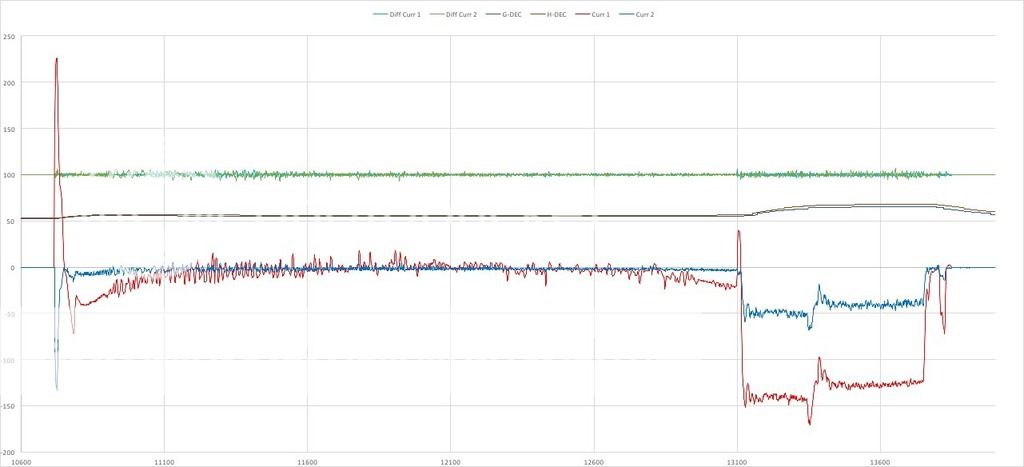
This diagram shows Current 1 and Current 2 on the AC motor / generator (red and blue traces). also, it shows (if I understand correctly) the difference in percentage between target current and real current, for both cCurrent 1 and Current 2 (the green and blue traces hugging the 100 mark all the time). The other two traces I suspect to be coil temperatures, but I have not been able to map them exactly.
Generator Currents (zoomed in)
Same as above but zoomed in into the more interesting part of the 7.5 minutes.
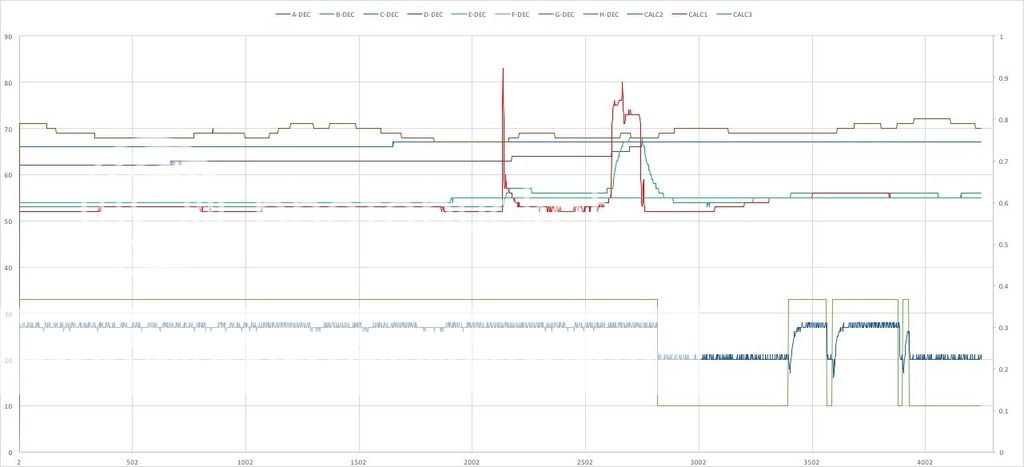
Some undefined stuff (approx. 4.400 data frames captured during 7.5 minutes)
If you have any idea what this could be, by all means, let me know


