Torque build up "off the line"

Mitsubishi Outlander PHEV Forum

Help Support Mitsubishi Outlander PHEV Forum:

This site may earn a commission from merchant affiliate links, including eBay, Amazon, and others.

anko

Well-known member
Joined
Dec 1, 2014
Messages
3,405
Location
Netherlands, Utrecht area
There was some discussion back and forth today, regarding the off the line performance of the E-motors. It was said that measurements were no good as long as we could not plot the development of output over time. SO, I spent a little time building a dedicated logger for:
- Front motor RPM
- Front motor Torque
- Rear motor RPM
- Rear motor Torque
- Generator RPM
- Generator Torque

By making this dedicated, I could reduce my sweep time to about a third of a second, resulting in some interesting pictures.

First attempt:
- Engine warmed up and running (the teal trace shows how the generator is used to start the engine (spike up) and then starts producing power.
- Foot on the brake
- Then move foot away from brake to throttle and hit it as hard as possible
ATTEMPT2_zps9quogkfu.jpg


You see that torque builds up very quickly to maximum and stays at maximum at least until I hit 52 km/h. Next reading is 58 km/h and there torque is dropping as max power has been reached.

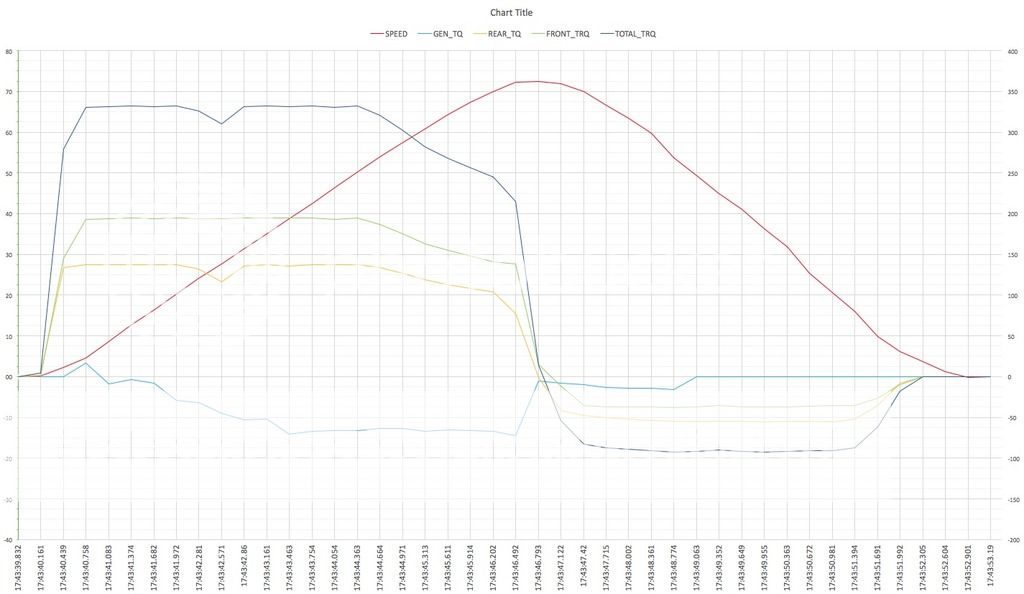
Second attempt:
- Engine warmed up and NOT running
- Foot on the brake
- Then move foot away from brake to throttle and hit it as hard as possible
ATTEMPT1_zpska24zdzl.jpg


You see a dip in Rear motor Torque around 25 km/h as the battery is fully utilised and the generator is still ramping up. Interestingly enough, the Front motor keeps going full torque, where the rear motor must wait for the additional power form the generator to arrive.

The engine is started within approx. 0.5 seconds after slamming the throttle, even though the battery has enough power to manage the first full 2 seconds by itself.

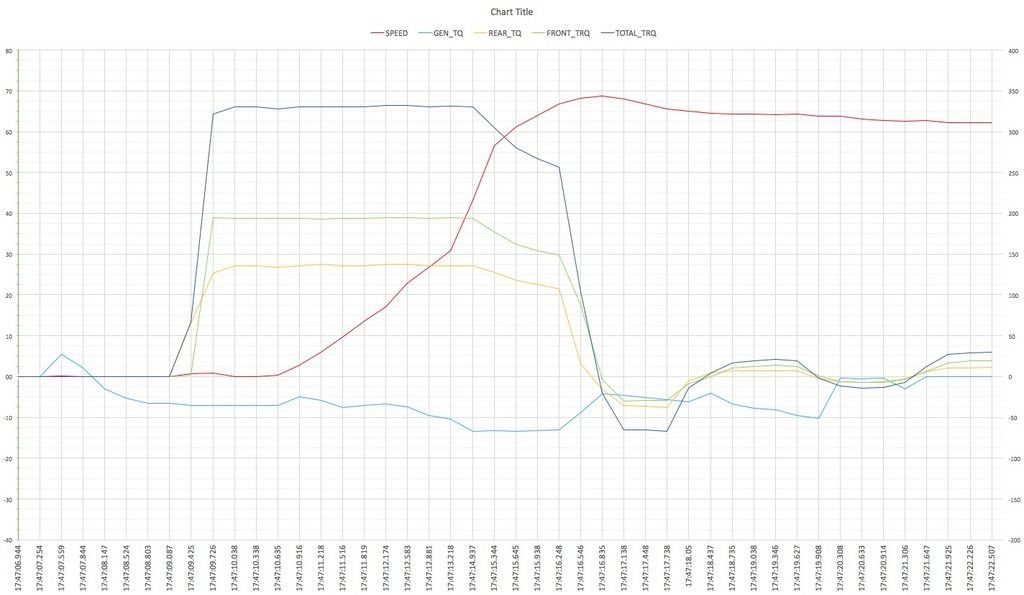
Third attempt:
- Engine warmed up and running (the teal trace shows how the generator is used to start the engine (spike up) and then starts producing power.
- Foot on the brake
- Other foot full on the throttle
- Then let go off the brake
ATTEMPT5_zpskfx6gixx.jpg


You see how torque builds up to max before taking off.

The apparent increase of acceleration is caused by the fact that measurements are further apart. Too bad!

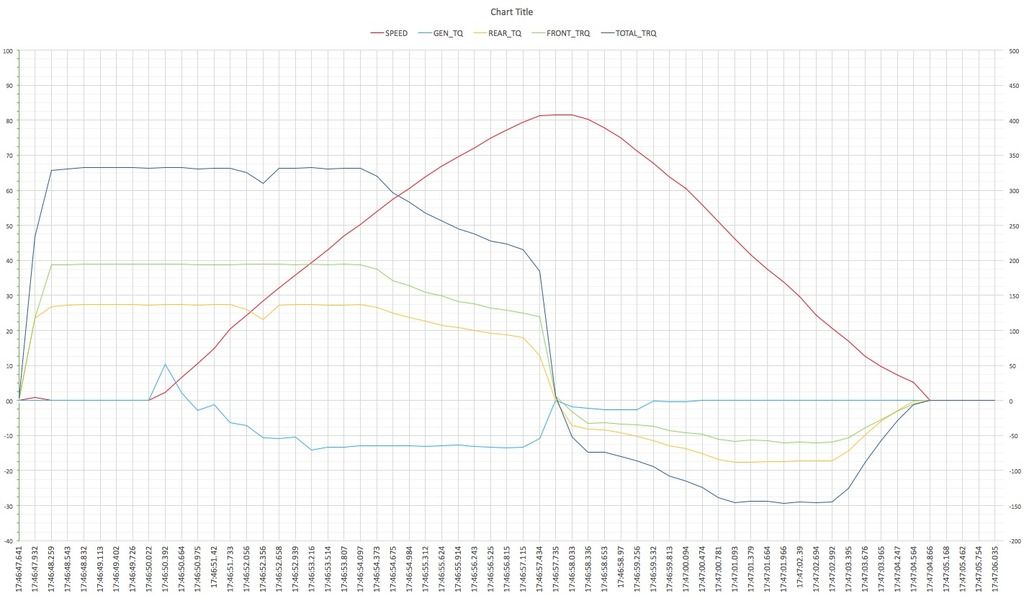
Fourth attempt:
- Engine warmed up and NOT running (the teal trace shows how the generator is used to start the engine (spike up) and then starts producing power.
- Foot on the brake
- Other foot full on the throttle
- Then let go off the brake
ATTEMPT4_zpsatzq71dq.jpg


Again, torque build up to max before taking off. But engine is started only just after take off.

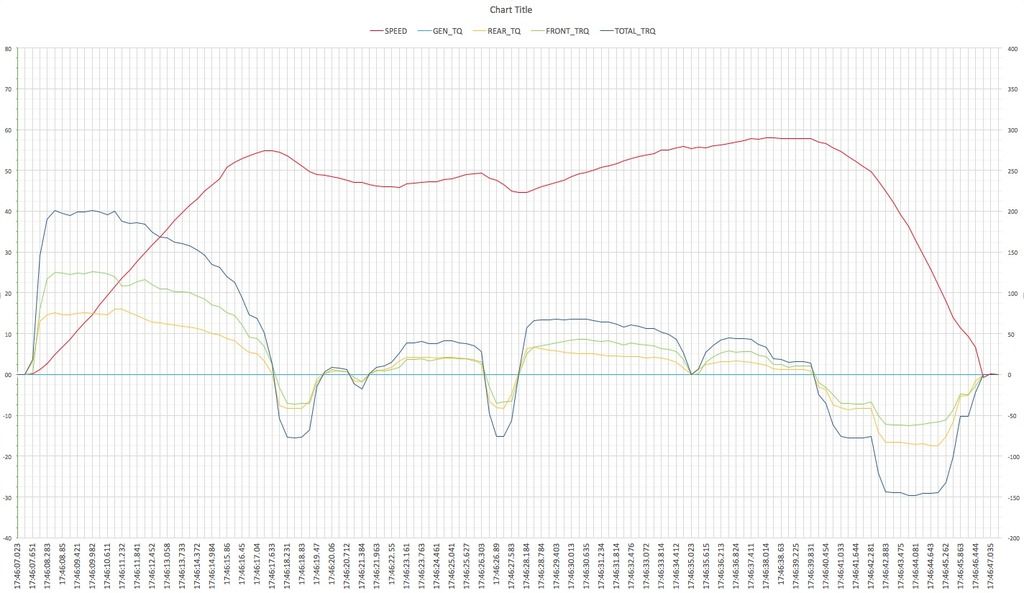
Last picture show a random section of driving. All within EV range:
ATTEMPT3_zpsynug9k8q.jpg


Tomorrow, I'll add same set of graphs, showing kW instead of Nm.
 
Very interesting, thanks. Now we can start wondering how Mitsubishi managed to cut two seconds from a standing start with the power specifications the same...
 
jaapv said:
Very interesting, thanks. Now we can start wondering how Mitsubishi managed to cut two seconds from a standing start with the power specifications the same...
Yes. I guess we need a volunteer with an MY16 and a WiFi OBD adapter ... and a bit of guts to get any further ....
 
But what ~is~ maximum torque other than an arbitrary limit set in software that decides how much mean current is applied by use of the pulse modulation? It does not mean the motors cannot produce yet more still.

That limit will have been decided by Mitsubishi during development as a compromise between what they thought would keep the motors reliable, the batteries not too stressed, the controllers from stress and reasonable consumption retaining the EV range to their target level.

Many tens of thousands of PHEV's have done probably millions of miles now so they will have vastly more component failure rate data and time to do more development work so have no doubt concluded that the drive train can withstand higher currents and torque than the nominal '100%' for the few seconds it takes a PHEV to reach 25mph.

And yes, a comparison of kw not torque between models would be the killer data. :cool:
 
BobEngineer said:
... so have no doubt concluded that the drive train can withstand higher currents and torque than the nominal '100%' for the few seconds it takes a PHEV to reach 25mph.
I don't know how you can be so sure, but three of the four examples show 4 - 4.5 seconds to reach 50 km/h (which is more than 25 mph). Taking off 2 full seconds from the 0-25MPH time (as was suggested earlier) would require the output of there motors to be doubled at least.
 
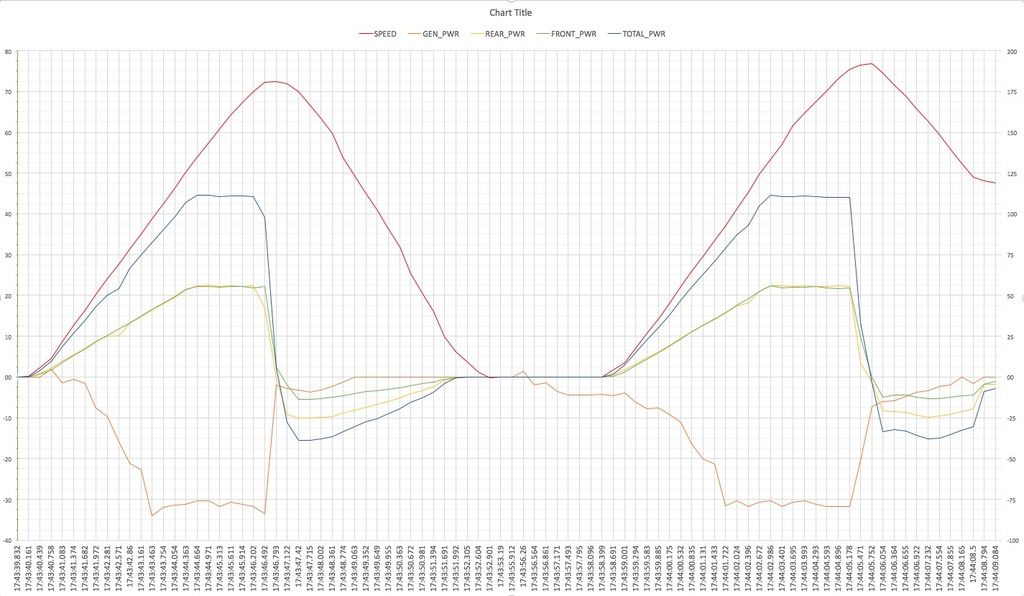
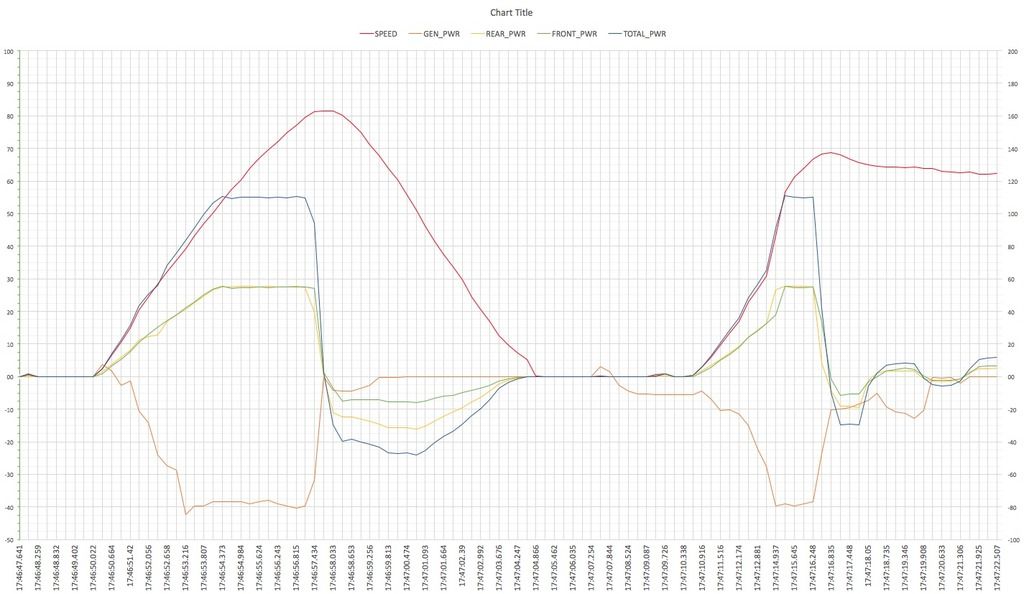
So, here is the kW side of it. Be aware: this is not electrical kW but mechanical kW (torque * rpm * some magic number). Electrical kW is not too relevant for now, because when differences were to be found, they could as well be related to increased / reduced efficiency as to increased / reduced performance. For the generator, maybe it would be better to have the electrical output, but that is simply not available (yet).

First without 'pre build up of torque', engine not running and engine running in one graph:

ATTEMPT1and2KW_zpssv25im8y.jpg


Next, with 'pre build up of torque', engine not running and engine running in one graph:

ATTEMPT3and4KW_zpss3xouzgs.jpg


Above you see no power build up before actual take off. This is because power mechanical power. With RPMs being 0, power is too. The little bumps all the way at the beginning and at 17:47:09 are IMHO caused by the very little movement the car makes when you hit the throttle while on the brakes.

Again, be aware of the wider spacing between measurements.

Than again part the EV section in between the above:

ATTEMPT3_zpsynug9k8q.jpg
 
I don't claim that this adds anything particularly scientific but I took this video this morning.
100% SOC
Charge enabled
Straight from the brake pedal to the accelerator (so no pre power loading).

I need to calibrate the speedo with a GPS unit but depending on the accuracy and lag of the speedo, I would say 25mph is reached in about 3.4sec and 60mph takes somewhere between 8.8 and 9.4sec.

Like I said, it's not scientific and no conclusions can be drawn but you may find it interesting.

https://www.youtube.com/watch?v=aSlKNfSwRYQ

Ideally I would have the data from the same source as Anko's graphs. If someone can tell me what I need to be able to do this I might be willing to give it a go.
 
DazzyB said:
Ideally I would have the data from the same source as Anko's graphs. If someone can tell me what I need to be able to do this I might be willing to give it a go.

That would be huge! What you would need is:
- an OBDII WiFi dongle (would cost you around 20 - 500 EURO depending on ...., unless you can borrow one)
- a laptop with WiFi
- a little Java program that I can provide
- some instructions that I can provide

BTW: does your engine actually start when you hit Charge @ 100% SOC? Mine doesn't.
BTW2: Video seems flagged as private. Won't let me watch ...
 
Yep. Can see it now. Definitely need data :mrgreen:

BTW: My data does not use GPS speed, but calculates speed from motor rpm, gear ratios, tire circumflex, etc (as I wanted to collect as little data as possible, to get the shorter sweep time). But the tires are not new. Two are one season old, the other two have 3 or 4 seasons behind them. Therefor, I average out front and rear results but still end up with a somewhat flattered values. But should not be too bad.
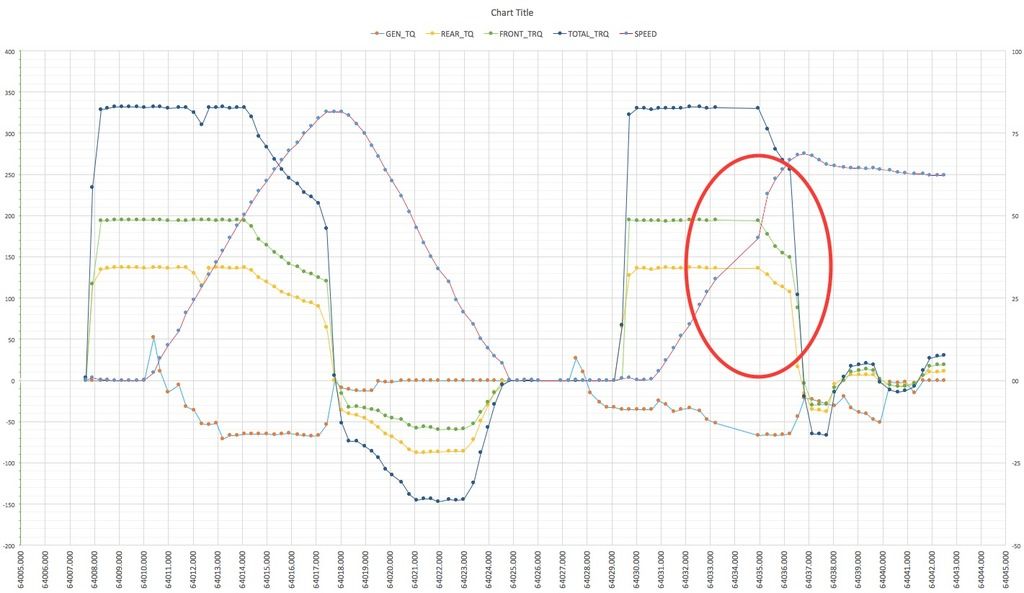
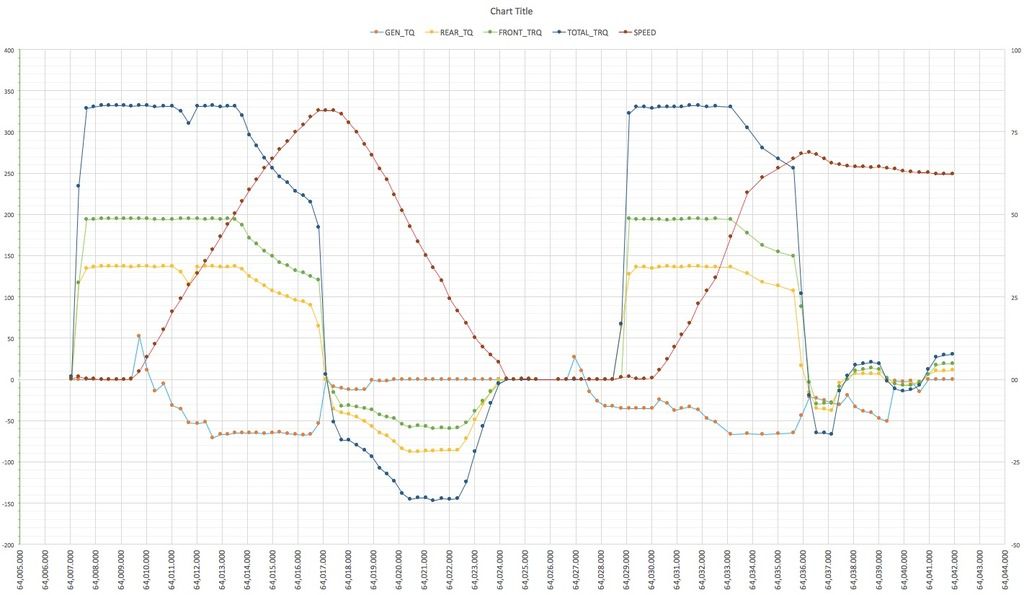
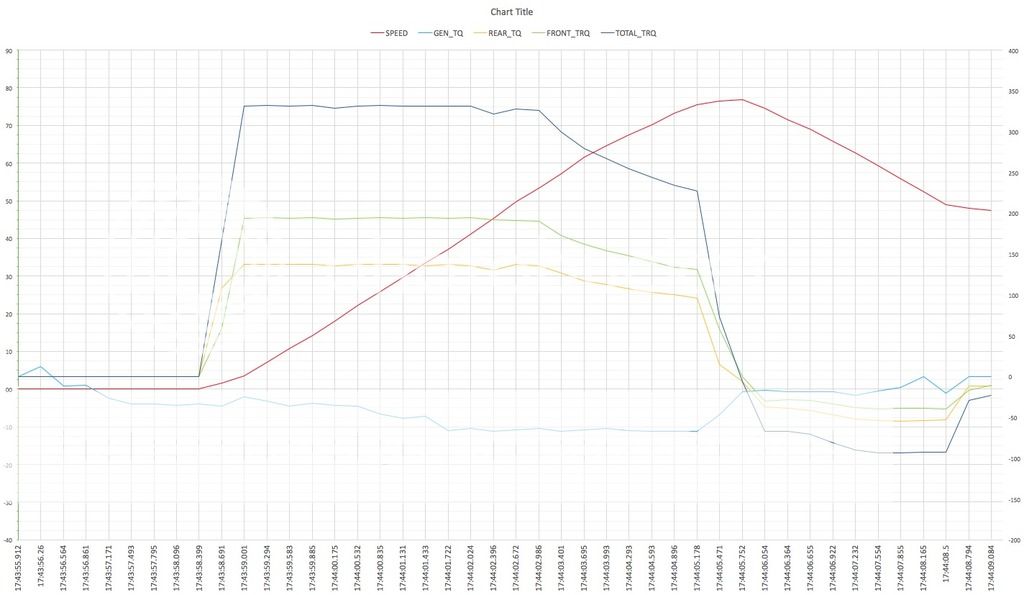
Also I have looked at enhancing the graphs. Instead of a normal graph, I've been looking at scatter graphs, as these allow me to have a linear time based X-axis. The first version I created reveals an issue (see red oval):

ATTEMPT3and4TQ%20Scattered_zpshuy7oalm.jpg


Not only are measurements spread out a bit further, but it seems 'as if' at least one measurement is received late. The timestamp was may not match the moment of the measurement. Which is quite possible. Therefor I created a second graph in which I used the average of the current timestamp plus the last 4 timestamps as value for the X-axis:

ATTEMPT3and4TQ%20Scattered%20Corrected_zpsgaidytp0.jpg
 
Apart from how Mitsubishi achieved the claimed increase technically, perhaps simple speed plotting with a GPS app? I have not heard of any that are really reliable or accurate though, and there are many of them.

Professional testers use dedicated devices with custom GPS designed for the task from what I have read.

But the other thing is the time from the pedal hitting the carpet to the car reacting, acceleration video or GPS tracking shows what happens when the engine management decides to react and/or the gauges move, not the time in-between which could also have been improved.

For true 'off the mark' it needs total time from the pedal hitting carpet to the speed being hit comparison. Its a lot easier to take peoples word for it that it feels quicker than their old ones! :lol:
 
This is how Mitsubishi sells it at least:

(4) Better acceleration
Acceleration and response from a full stop in urban environments as well as on the move has been improved after revising the Plug-in Hybrid EV system.

http://www.mitsubishi-motors.com/publish/pressrelease_en/motorshow/2015/news/detail0980.html

I'd be more than happy to record acceleration figures as long as I don't have to spend a fortune on a wifi OBD adapter. I have a bluetooth adapter already but I'm guessing that dosen't help.
Tell me what adapter do get and I'll give it a go.
 
BobEngineer said:
But the other thing is the time from the pedal hitting the carpet to the car reacting, acceleration video or GPS tracking shows what happens when the engine management decides to react and/or the gauges move, not the time in-between which could also have been improved.

For true 'off the mark' it needs total time from the pedal hitting carpet to the speed being hit comparison.

I tried to account for this in my video. I shouted "go" when I hit the floor with the pedal so that I would have a clear point to start the clock at zero. You can see that there is a delay between "go" and the car beginning to move and pick up speed. I suspect that this delay may be improved compared to the old model but I don't think it can be 2 seconds better. Accepting the non-scientific nature of this experiment and the differences between Anko's method and mine in recording the acceleration, I would say there may be a one second improvement in the 0-25mph time (~4.5s vs ~3.5s). Half of this could be improved response, the other half.....????
 
Fragge said:
This is how Mitsubishi sells it at least:

(4) Better acceleration
Acceleration and response from a full stop in urban environments as well as on the move has been improved after revising the Plug-in Hybrid EV system.

http://www.mitsubishi-motors.com/publish/pressrelease_en/motorshow/2015/news/detail0980.html

I'd be more than happy to record acceleration figures as long as I don't have to spend a fortune on a wifi OBD adapter. I have a bluetooth adapter already but I'm guessing that dosen't help.
Tell me what adapter do get and I'll give it a go.
Well, as a matter of fact, I can imagine it can be done using a BT adapter. But first of all, you would need a laptop with BT connectivity. Then you would have to be able to talk to it from within a little Java program. Currently, I simply open a TCP/IP socket that I write to / read from. With BT, I guess you would have to open a comm port, or something like that. I can't think of any reason why it would not be possible (other than not knowing how to do it).

I use an iCarsoft i610 adapter (http://www.icarsoft.us/web/icarsoftus/allproducts/wifiobd/2012/201212/20121228160143miaik_1.html) which suits me well. But I have a cheap Chinese clone that works as well, although a bit slower. The commands I am using are very basic. so I would assume any adapter should do fine.

In the mean time, I was thinking about adding monitoring of throttle position or brake pedal. But any parameter I add increases sweep time and reduces the amount of measurements per second. So, I am a bit reluctant to do so. Also, if there was indeed a delay after pressing the throttle, wouldn't my test with pressing brake and throttle simultaneously not have taken care of that?
 
anko said:
Well, as a matter of fact, I can imagine it can be done using a BT adapter. But first of all, you would need a laptop with BT connectivity. Then you would have to be able to talk to it from within a little Java program. Currently, I simply open a TCP/IP socket that I write to / read from. With BT, I guess you would have to open a comm port, or something like that. I can't think of any reason why it would not be possible (other than not knowing how to do it).

I use an iCarsoft i610 adapter (http://www.icarsoft.us/web/icarsoftus/allproducts/wifiobd/2012/201212/20121228160143miaik_1.html) which suits me well. But I have a cheap Chinese clone that works as well, although a bit slower. The commands I am using are very basic. so I would assume any adapter should do fine.
Would you like to share which OBD commands you are using? I could probably hack something together.
 
Initialise:

ATZ (reset adapter)
ATSP6 (protocol 6)
ATS0 (no spaces)
ATH0 (no headers)
ATE0 (no echo)
ATL1 (add linefeed to responses to make it human readable)

And then, per sweep:

ATSH753 (target Rear motor ECU)
2102 (request mode 21, pid 02)
ATSH755 (target Front motor ECU)
2102 (request mode 21, pid 02)
ATSH73C (target Generator ECU)
2102 (request mode 21, pid 02)
ATSH7E2 (target PHEV ecu)
2126 (request mode 21, pid 26)

Of course leave out the bits between () ;)

For the 2102 requests, you will get responses looking like this:

*6102XXXXYYYY*

So, by searching for 6102 in the response, you will be able to find XXXX and YYYY. Convert XXXX and YYYY from hex strings to integer values and then use these calcs:

Torque = XXXX/10 - 1000
RPM = YYYY - 20000

For the 2126 request, you should get a response looking like this:

*6126AAXXXXXX*

So, by searching for 6126, you will be able to find AA. Covert AA from hex to integer value and divide by 10; This will give you pressure in the brake lines (in MPa.). So you can see when the brake is released. (Also, you can see when the friction brakes are applied because regen brakes can't handle it anymore, but that is a different topic)

By adding the brake pressure param, sweep times should be 1/3 longer than they were yesterday. I have prepared something for later today that will test brake pressure during every sweep, until the pressure is 0. From then on it will test only once every 10th sweep. Until it finds a value > 0 again.
 
I find it weird that we are worrying about an aspect that is completely at odds with the benefits of the PHEV. Heavy acceleration has to be the worse use of the small amount of battery energy we have available. Where does the ECO button feature?
 
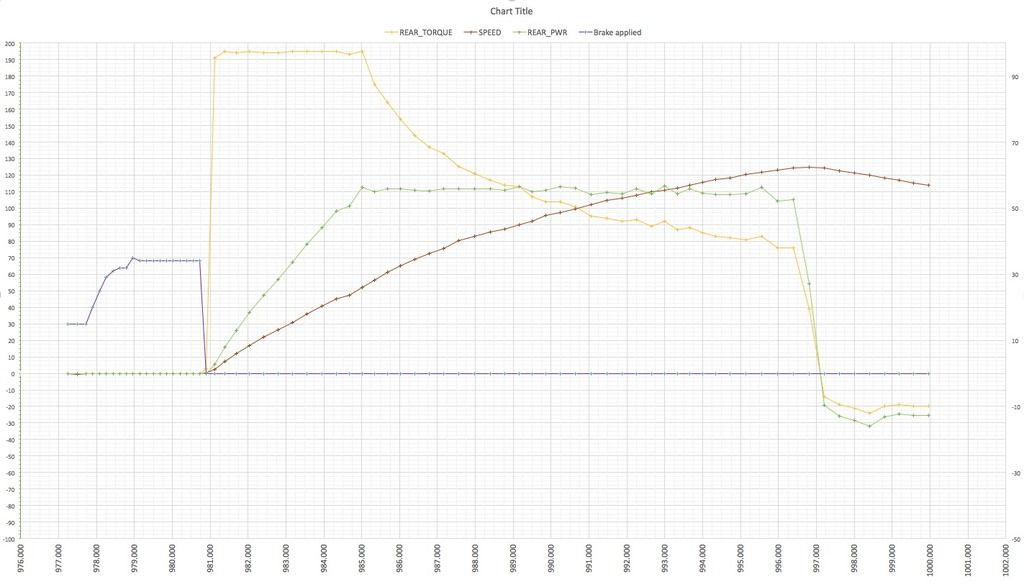
Did a first attempt plotting torque / power build up in relation to "start of test".
For this, I added a parameter showing "pressure in the brake line": as soon as I lift my foot off the brake, this value should go to 0.

Brake%20Grpah_zpszod7c5sq.jpg


If have not captured generator and front motor params, in order to reduce swipe time to the smallest possible value. Unfortunately, I had a little programming error,
cause every second reading to produce only 0s. I have removed these lines from the data, and the result is still not bad. But not as good as I think it could be.

You can see that the first reading with "brake pressure" 0 already shows a little torque. By time of the second reading after brake release it is almost at max.
Keep in mind, timestamps are not real-tie, but near real time.

Brake%20Data_zpssi3phxii.jpg
 
Back
Top