ICE startup phase

Mitsubishi Outlander PHEV Forum

Help Support Mitsubishi Outlander PHEV Forum:

This site may earn a commission from merchant affiliate links, including eBay, Amazon, and others.

anko

Well-known member
Joined
Dec 1, 2014
Messages
3,405
Location
Netherlands, Utrecht area
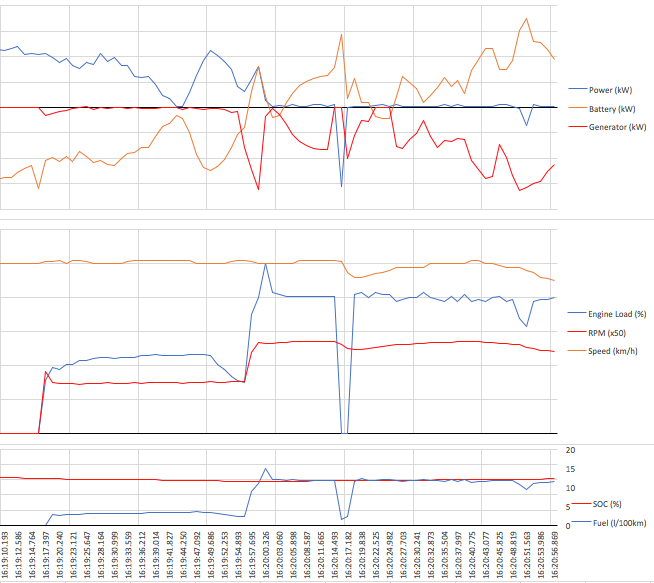
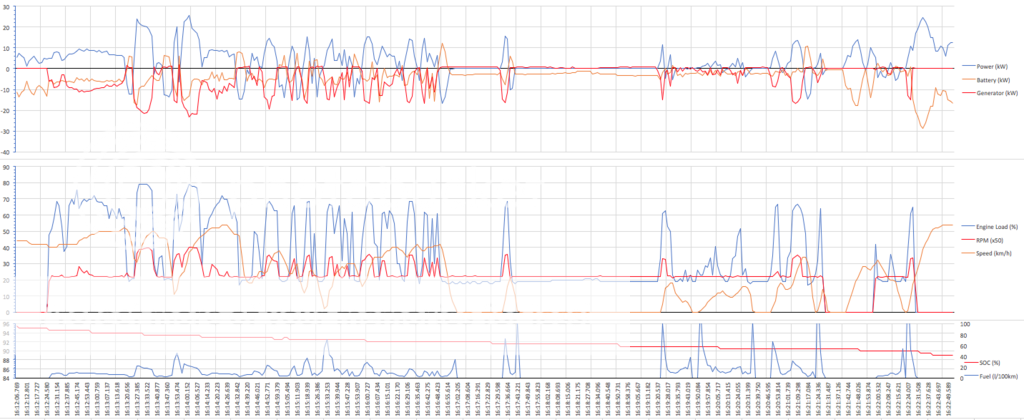
A lot has been said / speculated about what goes on when the engine is first started. How many RPMs? For how long? The blue arrow lights up intermittently, but is the battery charged in this phase? Etc. The left half of below picture gives us some more insight:
Startup%20phase_zpsnmtc7qza.png


What does it tell us:

- There is about 40 seconds of low RPM (1500) before parallel drive is engaged.
- During this phase, fuel consumption is between 2.2 and 3.5 l/100km (or 2.2 and 3.5 l/h actually, since there is no relationship between engine behaviour and speed in this phase and I happened to be driving 100 km/h)
- Apart from a very small spike (dip) the generator does not absorb any mechanical power from the engine. So, no electricity is generated.
- When it all starts (16:19:16) there is a short spike of battery output (well, a dip but negative means output here) which is not met by a peak of E-motor output. I believe this spike must represent the power needed to start the engine. (You would expect to see a positive value for the generator trace (red line) because the generator is briefly producing mechanical output. But I could have easily missed it as OBD values are read once every 1.5 seconds and the peak should be very narrow. The dip in the battery trace is only one measurement wide.)
- Around 16:19:44, battery output is about 3.6 kW while generator and E-motors are doing noting. I think this is explained by losses plus power needed to eliminate E-drag in E-motors and generator.
Around 16:20:31, the generator absorb 5.2 kW of mechanical input. At that time, the E-motors output about 0.4 kW of mechanical output (most likely the rear one for the 4WD effect) and the battery accepts 1.8 kW of electrical input. The difference of 3.0 kW is most likely explained by losses and power needed to eliminate E-drag in the front motor.
 
Anko has confirmed the instant petrol consumption of 12L/100km at 100kph that I have also seen extensively from my PHEV, seen in the lower graph posted above.
 
anko said:
A lot has been said / speculated about what goes on when the engine is first started. How many RPMs? For how long? The blue arrow lights up intermittently, but is the battery charged in this phase? Etc. The left half of below picture gives us some more insight:

Startup%20phase_zpsnmtc7qza.png


What does it tell us:

- There is about 40 seconds of low RPM (1500) before parallel drive is engaged.
- During this phase, fuel consumption is between 2.2 and 3.5 l/100km (or 2.2 and 3.5 l/h actually, since there is no relationship between engine behaviour and speed in this phase and I happened to be driving 100 km/h)
- Apart from a very small spike (dip) the generator does not absorb any mechanical power from the engine. So, no electricity is generated.
- When it all starts (16:19:16) there is a short spike of battery output (well, a dip but negative means output here) which is not met by a peak of E-motor output. I believe this spike must represent the power needed to start the engine. (You would expect to see a positive value for the generator trace (red line) because the generator is briefly producing mechanical output. But I could have easily missed it as OBD values are read once every 1.5 seconds and the peak should be very narrow. The dip in the battery trace is only one measurement wide.)
- Around 16:19:44, battery output is about 3.6 kW while generator and E-motors are doing noting. I think this is explained by losses plus power needed to eliminate E-drag in E-motors and generator.
Around 16:20:31, the generator absorb 5.2 kW of mechanical input. At that time, the E-motors output about 0.4 kW of mechanical output (most likely the rear one for the 4WD effect) and the battery accepts 1.8 kW of electrical input. The difference of 3.0 kW is most likely explained by losses and power needed to eliminate E-drag in the front motor.

Beautiful graphs, but can I ask Anyone who is going to put up future ones to have values that mean something on the x & y axis, the top two graphs are really difficult to decipher. Sorry guys, you are doing a great job. But, if mere mortals can't read it they will switch off, and there will be a load of new people here who haven't yet got into the theory behind the build of the car. :oops:
 
I will answer this graphing question here, but is a bit OFF topic. I have a legend to the LHS of my graphs, and the maximum and minimum, as well as data usually where a vertical line has been placed on the graph, with the colour and data labels. The time axis is not as yet scaled, but usually it does not matter. The grid I use divides the vertical into 10 sections and the horizontal into 12 sections. I did request some input from the forum admin, but as yet, there has been no feedback. We can log a lot of data, but possibly not all at the same time. My own graphing program is particular to what I think is important and is not particularly adaptable to individual choices of data to plot. I may get to change this. I will have a look at what my PHEV does under high power demands.
 
jaapv said:
Do you have a similar analysis of the ICE startup at "kickdown"/
Sure. This is for a "full throttle take off at the lights":

Kick%20down_zpsfp5vaky6.png


Top graph 50 kW per grid line
Middle graph 20 "units" per grid line
Bottom graph, SOC trace is scaled from 41 to 46%. Not very relevant in this case ....

This was with a warm engine. Can produce a similar picture for a cold engine, but for this I will need access to your car .... :mrgreen:
 
gwatpe said:
Anko has confirmed the instant petrol consumption of 12L/100km at 100kph that I have also seen extensively from my PHEV, seen in the lower graph posted above.
As I explained in a PM to you, I have my own simple version of l/100km (based on Mass Air Flow and speed) and a TP version (of which we do not know exactly how it is calculated yet).

I have compared the two and I see differences ranging from a factor 0.3 (my value is 0.3 times the TP value) to 1.3 (my value is 1.3 times the TP value). Part of this can probably be explained by the fact that not all contributing parameters are retrieved from the ECU at the exact same time (a single sweep is about a second and a half, so this does play a role). But in general, it seems the TP value is about 1.1 times higher than my own value. To get a better understanding, I created a plot with both values (see blue and green traces in lower graph):

Two%20fuel%20values_zpskl3gh9bj.png


What you can see is that in general they seem not to far off, but the TP calculated value seems to fall behind. I think this tells us it is a calculated value based on another calculated value (which in turn is based on actual values from the ECU).

Look at two ways of calculating A + B and (A + B) * C:

D = A + B
E = D * C

If calculated PID D is calculated before A and B are retrieved, D will fall behind one cycle.
If calculated PID E is calculated before D ids calculated, E will fall behind two cycles compared to A and B.

X = A + B
Y = (A + B) * C

If calculated PID X is calculated before A and B are retrieved, X will fall behind one cycle.
If calculated PID Y is calculated before X ids calculated, Y will fall behind only one cycle compared to A and B.

For standardisation reasons, I think it would be best to use the TP version. But for 'timeliness' my own value seems more usable. Need to think this over ...

BTW: The above graph shows what happened this morning, when I hit Charge mode while still waiting for a traffic light. As I knew I would probably be hitting parallel speeds within 30 - 40 seconds, I thought it would possibly not be bad for efficiency …. And I think the graph shows it is not.

Edit - Looking a bit more closely, it seems the TP value fell behind only once. But it was so visible. This is what made me believe it was behind all the time.
 
jaapv said:
Do you have a similar analysis of the ICE startup at "kickdown"/

Good question which led to a great response, so I add mine : anko do you have similar analysis of the ICE startup just for heating ?
I think it could be done during 30" at a constant 0 kph ;)
 
Grigou said:
jaapv said:
Do you have a similar analysis of the ICE startup at "kickdown"/

Good question which led to a great response, so I add mine : anko do you have similar analysis of the ICE startup just for heating ?
I think it could be done during 30" at a constant 0 kph ;)
Some day, I will. To warm today.
 
The L/100km can wait till another day, but I have some more data from today, specific to the ICE startup.

Did not start from a standing start, as I am having a few issues with the logging stopping unexpectedly.

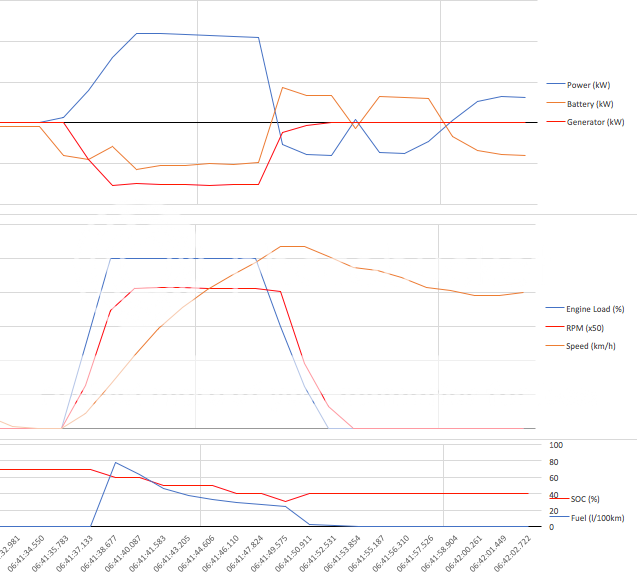
Here is what my PHEV recorded from a 30kph -90kph stomp on the gas.

acceleration.png


This was a 100% ICE load test.

the blue line [speed] increased linearly.
the battery supplied just over 200A, around 60kW, and the ICE took a few seconds to kick in, 100%load , and this reduced the battery current to about 130A, still with 100% ICE load, and the RPM peaked at 4100. Throttle was above 80%.

Will need to log generator power as well to fill in some gaps.

Even so, some indication of how the PHEV is unloading the battery with the ICE is shown.

still more questions??
 
anko said:
Grigou said:
jaapv said:
Do you have a similar analysis of the ICE startup at "kickdown"/

Good question which led to a great response, so I add mine : anko do you have similar analysis of the ICE startup just for heating ?
I think it could be done during 30" at a constant 0 kph ;)
Some day, I will. To warm today.

You know you can do the test even at smooth outside temperatures I presume ? Maybe with more difficulties since your car is an Instyle and mine is an Intense. Did you tried to push the T° to 30 °C ?

I did a lot of tests in summer (15°C to 25°C outside) just to understand the criterias involved to start the ICE (outside T°, inside T°, coolant T° ... ?). But without instruments it's difficult to conclude. Nevertheless I know now that the outside temperature is not the only one ...
 
Tipper said:
Wow! Great graphs! Thanks guys.

(And I thought ECGs were difficult to interpret! :lol: )

I can interpret and understand ECGs, but none of these make any sense at all to me. I guess that might well be because I understand the anatomy and physiology of the heart, but not a car!
 
Grigou said:
Did you tried to push the T° to 30 °C ?
Because you asked so nicely :mrgreen:

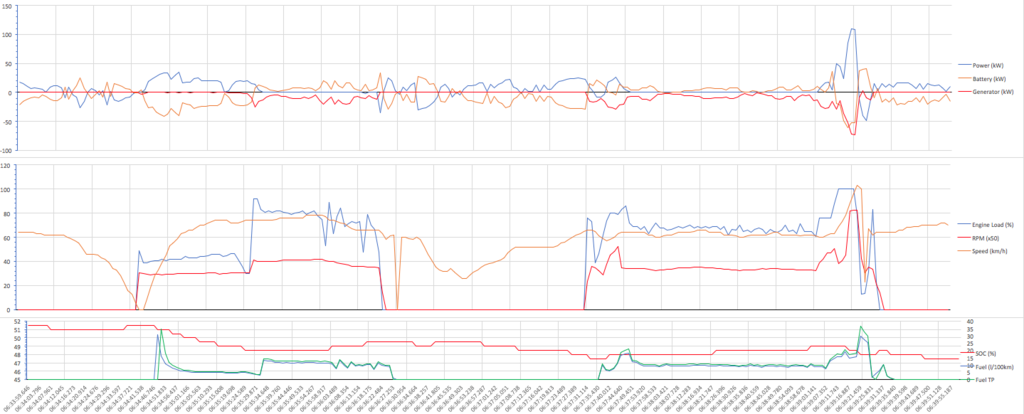
Engine%20starts%20for%20heating_zpsxaipwnvk.png


This was while driving in the city. So lots of stops at traffic lights mixed with serial speed driving. The graph shows that the generator does what is needed for driving, but no more than that. As far as I can tell, it does not even generator electricity for the electric heater, which was also running full steam as the engine was still cold.

In the middle section you see two stops (at the same traffic light :evil: ) where:
- The engine is running 20% load at 1100 RPM.
- Generator is doing vertically nothing
- Battery is loosing electricity at a rate of 1.5 - 3.5 kW. This power could only have gone to the electric heater.

Fuel consumption seems to be non existing, but is in reality infinitive, as I was doing 0 km/h.

Oh, and I did try to increase efficiency by engaging Charge mode, but that didn't make any difference as (apparently) SOC was too high with 90+%.
 
Back
Top