-
If you have not please join our official My Outlander PHEV Facebook Group!
Mitsubishi Outlander PHEV Facebook Group
You are using an out of date browser. It may not display this or other websites correctly.
You should upgrade or use an alternative browser.
You should upgrade or use an alternative browser.
Help, I need assistance with this graph.
- Thread starter Trex
- Start date

Help Support Mitsubishi Outlander PHEV Forum:
This site may earn a commission from merchant affiliate
links, including eBay, Amazon, and others.
Trex
Well-known member
Now,

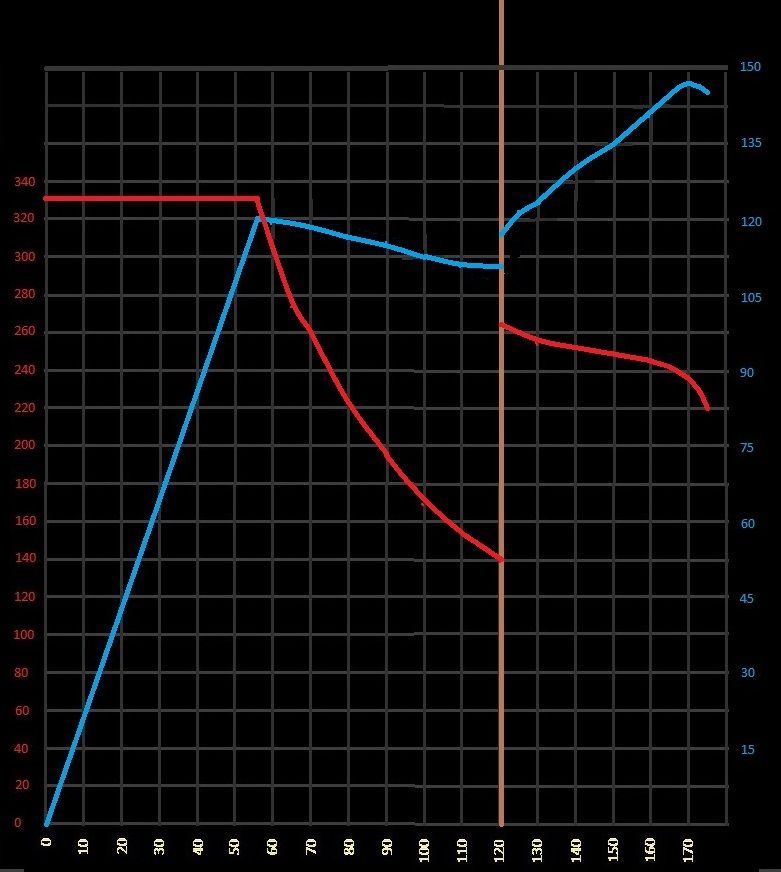
This last graph I have made myself from a combination of those previous graphs.
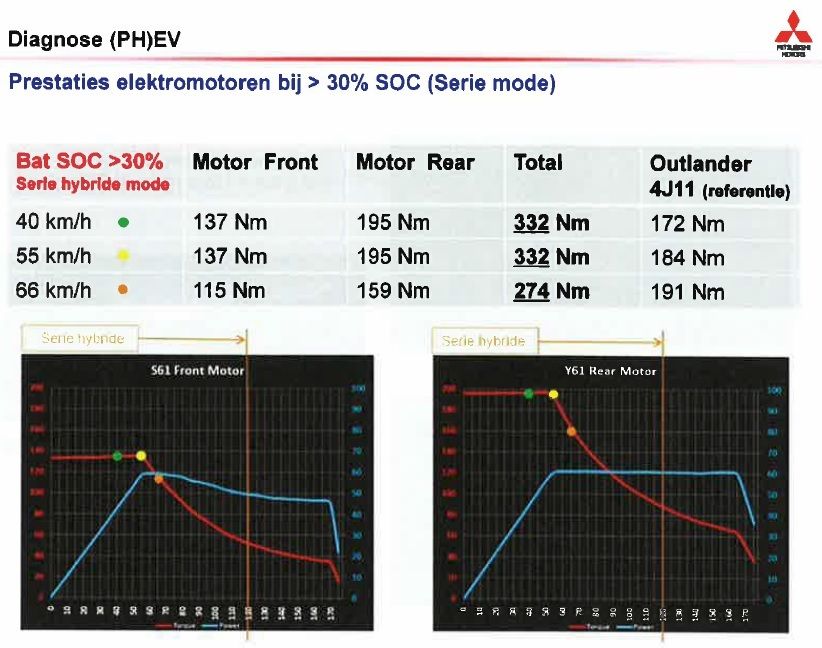
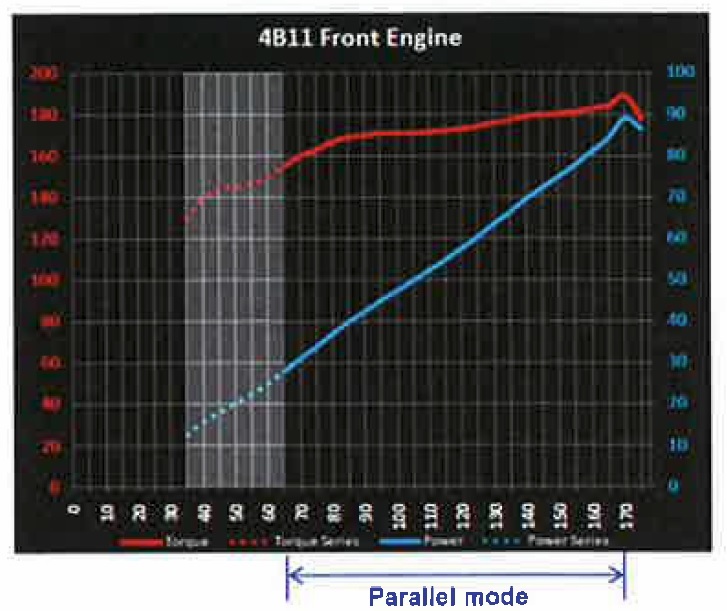
In all graphs Blue is power in kw red is torque in Nm and across the bottom is speed in kph.
Left of brown line is series mode. Right of brown line is parallel mode
I will fix up legends etc once I know this graph is correct.
Now before I post this in the sticky discussion. Can anybody please check that I have made the right calculations or assumptions. This power and torque at "wheels" foot flat to the floor.
My assumptions series mode (left of brown line) add torque and power of front and rear electric motors (energy comes from 60kW battery, 60Kw generator). see first post graphs
My assumption parallel mode (right of brown line) add torque and power of Petrol motor (driving front wheels) and rear electric motor (energy comes from petrol motor and 60Kw from battery). see first post graphs
Do these assumption sound right? I just do not like the look of that big jump in torque (in my graph) at the brown line and to the right in parallel mode.
Regards Trex.
Trex
Well-known member
Oh duh, 
I have not taken reductions into consideration. Torque of Petrol motor is taken at flywheel.
On the graphs in first post Torque on electric motors could be taken at shaft of electric motors or wheel axle?
Anyone?
Back to the drawing board.
Regards Trex.
I have not taken reductions into consideration. Torque of Petrol motor is taken at flywheel.
On the graphs in first post Torque on electric motors could be taken at shaft of electric motors or wheel axle?
Anyone?
Back to the drawing board.
Regards Trex.
anko
Well-known member
Although the e-motors do not have a flywheel (unless you will considere the actual wheels of the car to be fly wheels), their torque is indeed measured at their shafts. This is why I said early that's t is better (safer) to compare power than torque  Actual ratios are somewhere in the pdf.
How do I know for sure: to raise 320 Nm of torque at the wheels at 56 km/h takes way less than 120 kW. It takes about 1/7th to 1/9th of 60 kW.
As the ratio for the motors is way higher than for the engine, you will see that the two red lines get much closer to each other at the brown line.
Brown line should be a bit more to the right (closer to 130 than 120).
Also the jump up in the blue line raises a bit of suspicion. If, at 120 km/h, power in parallel mode was higher than in serial mode, why would they not engage parallel mode a lower speed?
Trex
Well-known member
anko said:Although the e-motors do not have a flywheel (unless you will considere the actual wheels of the car to be fly wheels), their torque is indeed measured at their shafts. This is why I said early that's t is better (safer) to compare power than torqueActual ratios are somewhere in the pdf.
How do I know for sure: to raise 320 Nm of torque at the wheels at 56 km/h takes way less than 120 kW. It takes about 1/7th to 1/9th of 60 kW.
As the ratio for the motors is way higher than for the engine, you will see that the two red lines get much closer to each other at the brown line.
Brown line should be a bit more to the right (closer to 130 than 120).
Also the jump up in the blue line raises a bit of suspicion. If, at 120 km/h, power in parallel mode was higher than in serial mode, why would they not engage parallel mode a lower speed?
Hey anko,
I will cover blue line first. I agree. Why not go into parallel mode quicker? If you look at electric motor graphs see how the front Electric motor's power plot decreases before 120kph. That is all my graph is showing. Is there something else happening?
Ok I found the ratios in pdf. You are right that the torque must be taken at the electric motor shaft and I will try again with my torque plots.
Thank you for your help.
Regards Trex.
Similar threads
- Replies
- 0
- Views
- 201
- Replies
- 1
- Views
- 311
- Replies
- 9
- Views
- 976
- Replies
- 0
- Views
- 291


